t
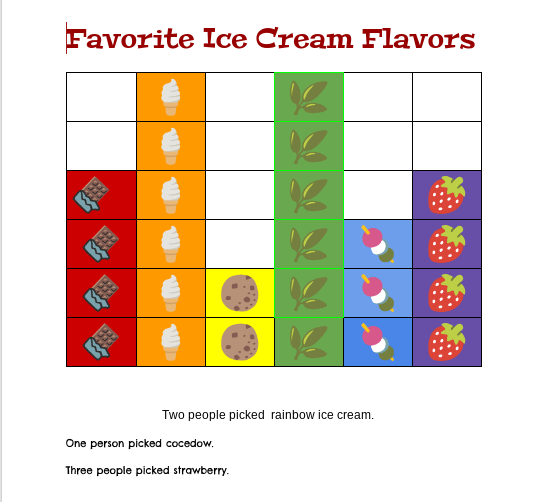
With each first grade lesson, I try to incorporate many "tech-based" skills- everything from right clicking to dragging and dropping. This week's lesson involved one of the math skills and standards that was being addressed in instruction- creating and analyzing graphs. In terms of technology integration, we always begin with the goal in mind, not the tool. Google Docs ended up being a tool that met our purpose here. Nothing super fancy or extra needed. First, we looked a pictograph and engaged in some "math talk" as we analyzed the data. Students activated prior knowledge and warmed up for our activity.
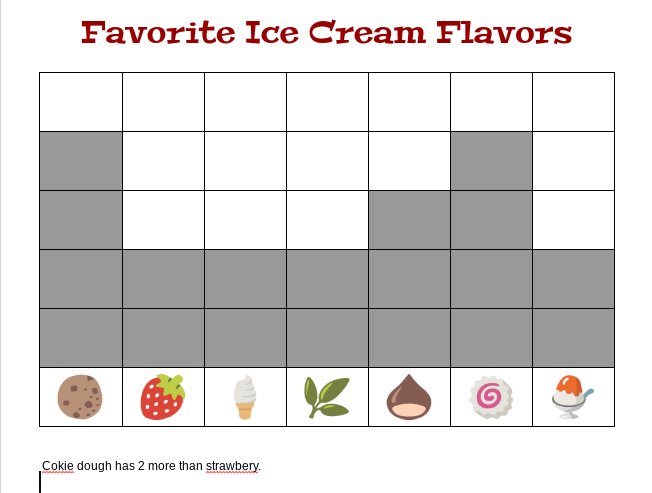
Then, we taught the students how to insert emojis (not as images, but rather as special characters) into their graphs to represent ice cream flavor choices. It was important for them to access the insert menu and then change the keyboard option to be emojis. Afterwards, we taught the kids how to fill boxes/cells of a table to, in essence, make the graph. The kids found great success with clicking in the cell, then finding the paint bucket, but struggled with holding down and dragging to highlight multiple cells. So... needless to say...highlighting in general will be incorporated into the next lesson with these kiddos! Either way, this is a lesson we would totally recommend... full of content and tech skills for our students (and teachers :))!
0 Comments
Leave a Reply. |
Author(s)Jennifer Eggert Archives
August 2019
Categories |
 RSS Feed
